Intro
Hi folks.
This is a continuation of the previous post about my Kubernetes infrastructure located here. The two remaining points are to deploy Athens Go proxy and setting up monitoring.
Athens

Let’s start with Athens.
First of all if you are a helm user, Athens has an awesome set of helm charts which you can use to deploy it in your cluster. Located here.
I prefer to deploy my own config files, but that’s me. So here is my preferred way of deploying Athens.
Since this is also a subdomain of the previously created powerhouse namespace we are going to use that.
PVC
We are going to need a PersistentVolumeClaim for Athens so it can store all the things forever.
apiVersion: v1
kind: PersistentVolumeClaim
metadata:
  namespace: powerhouse
  name: athens-storage
spec:
  accessModes:
  - ReadWriteOnce
  resources:
    requests:
      storage: 10Gi
  storageClassName: do-block-storage
Claim is very boring. Which means it just works.
Deployment
This is more interesting. Athens provides a lot of possibilities for the deployment. I’m just deploying the barest possible here. Which means, no user auth, no private repository support, ssh key configuration, etc… It’s a plain proxy installation.
apiVersion: apps/v1
kind: Deployment
metadata:
  namespace: powerhouse
  name: athens-app
  labels:
    app: athens-proxy
spec:
  replicas: 1
  selector:
    matchLabels:
      app: athens-proxy
  template:
    metadata:
      labels:
        app: athens-proxy
        app.kubernetes.io/name: athens-proxy
        app.kubernetes.io/instance: athens-proxy
    spec:
      containers:
      - name: athens-proxy
        image: gomods/athens:v0.6.0
        livenessProbe:
          httpGet:
            path: "/healthz"
            port: 3000
        readinessProbe:
          httpGet:
            path: "/readyz"
            port: 3000
        env:
          - name: ATHENS_GOGET_WORKERS
            value: "3"
          - name: ATHENS_STORAGE_TYPE
            value: "disk"
          - name: ATHENS_DISK_STORAGE_ROOT
            value: /var/lib/athens
        ports:
          - containerPort: 3000
            name: athens-http
        volumeMounts:
          - name: athens-data
            mountPath: /var/lib/athens
            subPath: athens
      volumes:
        - name: athens-data
          persistentVolumeClaim:
            claimName: athens-storage
Fun fact. The name of the app must not be just plain athens because that will result in an error: too many colons in address.
The issue is here: https://github.com/gomods/athens/issues/1038#issuecomment-457145658 Basically it’s because of the name used for the environment properties inside the container.
Service
Now, let’s expose it.
kind: Service
apiVersion: v1
metadata:
  namespace: powerhouse
  name: athens-service
  labels:
    app: athens-proxy
    app.kubernetes.io/name: athens-proxy
    app.kubernetes.io/instance: athens-proxy
spec:
  selector:
    app: athens-proxy
    app.kubernetes.io/name: athens-proxy
    app.kubernetes.io/instance: athens-proxy
  ports:
  - port: 80
    targetPort: 3000
Ingress
I’m using port 80 here because it’s convenient. But if you use any other port, don’t forget to alter your ingress to forward to that port and service.
apiVersion: extensions/v1beta1
kind: Ingress
...
spec:
  tls:
...
  - hosts:
    - athens.powerhouse.com
    secretName: athens-cronohub-tls
  rules:
...
  - host: athens.powerhouse.com
    http:
      paths:
      - backend:
          serviceName: athens-service
          servicePort: 1234
        path: /
And that’s it! If you now visit https://athens.powerhouse.com it should say "Welcome to The Athens Proxy".
Now, if you set this proxy with export GOPROXY=https://athens.powerhouse.com it should start to cache modules. It’s a fantastic proxy with a lot of capabilities. I encourage you to check it out and drop by it’s slack channel on Gopher slack called Athens.
Monitoring
Monitoring is a huge topic so I’m not going to talk about how to monitor or what. That is described in great many of posts. I especially recommend reading sysdig’s 6 part post on doing monitoring with Prometheus and Grafana and what to monitor and the four golden signals and whatnot. Starting here and here.
Prometheus
I’m going to deploy Prometheus. Prometheus is a monitoring tool which sits inside your cluster and gathers data about running pods, nodes, services, whatever you expose and wants to send data to it. It can also alert on things and can be integrated with tools like Graphana for nice front-end and metrics. Prometheus itself uses PromQL as its query language to gather data from different sources and do time series analytics and much much more.
Please visit the website and documentation for more details. It’s the defacto monitoring tool for Kubernetes. Again, I’m going to do a very basic installation of Prometheus. So basic in fact, that I don’t even have a PVC for it, because I don’t care at this point about retaining data.
Namespace
Let’s create it’s own namespace.
apiVersion: v1
kind: Namespace
metadata:
  name: monitoring
  labels:
    name: monitoring
Config
Prometheus Server config is massive. I don’t expect you to pick up on everything in this thing, but I would encourage you to at least try to find out what these setting do… Our config yaml file contains the configuration file for Prometheus which we’ll later set up via a command line argument. It’s called prometheus.yml.
apiVersion: v1
kind: ConfigMap
metadata:
  name: prometheus-server-conf
  labels:
    name: prometheus-server-conf
  namespace: monitoring
data:
  prometheus.yml: |-
    global:
      scrape_interval: 5s
      evaluation_interval: 5s

    scrape_configs:
      - job_name: 'kubernetes-apiservers'
        kubernetes_sd_configs:
        - role: endpoints
        scheme: https
        tls_config:
          ca_file: /var/run/secrets/kubernetes.io/serviceaccount/ca.crt
        bearer_token_file: /var/run/secrets/kubernetes.io/serviceaccount/token
        relabel_configs:
        - source_labels: [__meta_kubernetes_namespace, __meta_kubernetes_service_name, __meta_kubernetes_endpoint_port_name]
          action: keep
          regex: default;kubernetes;https

      - job_name: 'kubernetes-nodes'
        scheme: https
        tls_config:
          ca_file: /var/run/secrets/kubernetes.io/serviceaccount/ca.crt
        bearer_token_file: /var/run/secrets/kubernetes.io/serviceaccount/token
        kubernetes_sd_configs:
        - role: node
        relabel_configs:
        - action: labelmap
          regex: __meta_kubernetes_node_label_(.+)
        - target_label: __address__
          replacement: kubernetes.default.svc:443
        - source_labels: [__meta_kubernetes_node_name]
          regex: (.+)
          target_label: __metrics_path__
          replacement: /api/v1/nodes/${1}/proxy/metrics

      - job_name: 'kubernetes-pods'
        kubernetes_sd_configs:
        - role: pod
        relabel_configs:
        - source_labels: [__meta_kubernetes_pod_annotation_prometheus_io_scrape]
          action: keep
          regex: true
        - source_labels: [__meta_kubernetes_pod_annotation_prometheus_io_path]
          action: replace
          target_label: __metrics_path__
          regex: (.+)
        - source_labels: [__address__, __meta_kubernetes_pod_annotation_prometheus_io_port]
          action: replace
          regex: ([^:]+)(?::\d+)?;(\d+)
          replacement: $1:$2
          target_label: __address__
        - action: labelmap
          regex: __meta_kubernetes_pod_label_(.+)
        - source_labels: [__meta_kubernetes_namespace]
          action: replace
          target_label: kubernetes_namespace
        - source_labels: [__meta_kubernetes_pod_name]
          action: replace
          target_label: kubernetes_pod_name

      - job_name: 'kubernetes-cadvisor'
        scheme: https
        tls_config:
          ca_file: /var/run/secrets/kubernetes.io/serviceaccount/ca.crt
        bearer_token_file: /var/run/secrets/kubernetes.io/serviceaccount/token
        kubernetes_sd_configs:
        - role: node
        relabel_configs:
        - action: labelmap
          regex: __meta_kubernetes_node_label_(.+)
        - target_label: __address__
          replacement: kubernetes.default.svc:443
        - source_labels: [__meta_kubernetes_node_name]
          regex: (.+)
          target_label: __metrics_path__
          replacement: /api/v1/nodes/${1}/proxy/metrics/cadvisor

      - job_name: 'kubernetes-service-endpoints'
        kubernetes_sd_configs:
        - role: endpoints
        relabel_configs:
        - source_labels: [__meta_kubernetes_service_annotation_prometheus_io_scrape]
          action: keep
          regex: true
        - source_labels: [__meta_kubernetes_service_annotation_prometheus_io_scheme]
          action: replace
          target_label: __scheme__
          regex: (https?)
        - source_labels: [__meta_kubernetes_service_annotation_prometheus_io_path]
          action: replace
          target_label: __metrics_path__
          regex: (.+)
        - source_labels: [__address__, __meta_kubernetes_service_annotation_prometheus_io_port]
          action: replace
          target_label: __address__
          regex: ([^:]+)(?::\d+)?;(\d+)
          replacement: $1:$2
        - action: labelmap
          regex: __meta_kubernetes_service_label_(.+)
        - source_labels: [__meta_kubernetes_namespace]
          action: replace
          target_label: kubernetes_namespace
        - source_labels: [__meta_kubernetes_service_name]
          action: replace
          target_label: kubernetes_name
Mostly it’s just setting up what Prometheus should monitor and how. The important bits are the labels. How this is going to work is, that we will annotate the resources we want Prometheus to see. Which is pretty cool. Basically we will just alter a pod to include an annotation and it will begin monitoring it. No need to install anything anywhere or restart anything. Just add an annotation and bamm, you’re done.
RBAC
Prometheus needs permissions to access resources in the cluster such as API end-points and gathering data about the cluster itself. We will provide it with this permission through Role Based Access Control.
We’ll create a service account which Prometheus can use. We want it to access the whole cluster so we’ll use a ClusterRole.
apiVersion: rbac.authorization.k8s.io/v1beta1
kind: ClusterRole
metadata:
  name: prometheus
rules:
- apiGroups: [""]
  resources:
  - nodes
  - nodes/proxy
  - services
  - endpoints
  - pods
  verbs: ["get", "list", "watch"]
- apiGroups:
  - extensions
  resources:
  - ingresses
  verbs: ["get", "list", "watch"]
- nonResourceURLs: ["/metrics"]
  verbs: ["get"]
---
apiVersion: rbac.authorization.k8s.io/v1beta1
kind: ClusterRoleBinding
metadata:
  name: prometheus
roleRef:
  apiGroup: rbac.authorization.k8s.io
  kind: ClusterRole
  name: prometheus
subjects:
- kind: ServiceAccount
  name: default
  namespace: monitoring
This will give access to monitor the following resources: nodes, nodes/proxy, services, endpoints and pods. The action are get, list, watch. No modifications.
We’ll also allow Prometheus to watch ingresses for data traffic and allow it to do get requests to non-resource endpoint /metrics.
Deployment
Now, the deployment is actually pretty easy.
apiVersion: extensions/v1beta1
kind: Deployment
metadata:
  name: prometheus-deployment
  namespace: monitoring
spec:
  replicas: 1
  template:
    metadata:
      labels:
        app: prometheus-server
    spec:
      containers:
        - name: prometheus
          image: prom/prometheus:v2.2.1
          args:
            - "--config.file=/etc/prometheus/prometheus.yml"
            - "--storage.tsdb.path=/prometheus/"
          ports:
            - containerPort: 9090
          volumeMounts:
            - name: prometheus-config-volume
              mountPath: /etc/prometheus/
            - name: prometheus-storage-volume
              mountPath: /prometheus/
      volumes:
        - name: prometheus-config-volume
          configMap:
            defaultMode: 420
            name: prometheus-server-conf
        - name: prometheus-storage-volume
          emptyDir: {}
The two interesting things here are the two arguments. The config file, which we include through the configMap and the storage. Which I’m not bind mounting.
Service
Let’s expose Prometheus. Now, this may come as a surprise if you don’t know anything about Prometheus, but this is an in cluster monitoring tool. It’s usually not supposed to be accessed directly, but through tools like Graphana or used by tools like Alerting or traefik as a reverse proxy. As such, Prometheus does not support authentication or authorization or user management of any kind. That is usually taken care of by a reverse proxy or other means written about here and here.
As such, we can do a number of things. We can expose it as a NodePort service for example:
apiVersion: v1
kind: Service
metadata:
  name: prometheus-service
  namespace: monitoring
  annotations:
      prometheus.io/scrape: 'true'
      prometheus.io/port:   '9090'

spec:
  selector:
    app: prometheus-server
  type: NodePort
  ports:
    - port: 8080
      targetPort: 9090
      nodePort: 30000
Or we just port forward the pod like this:
k port-forward pods/prometheus-deployment-6bf45557bd-qc6t6 9090:9090 -n monitoring
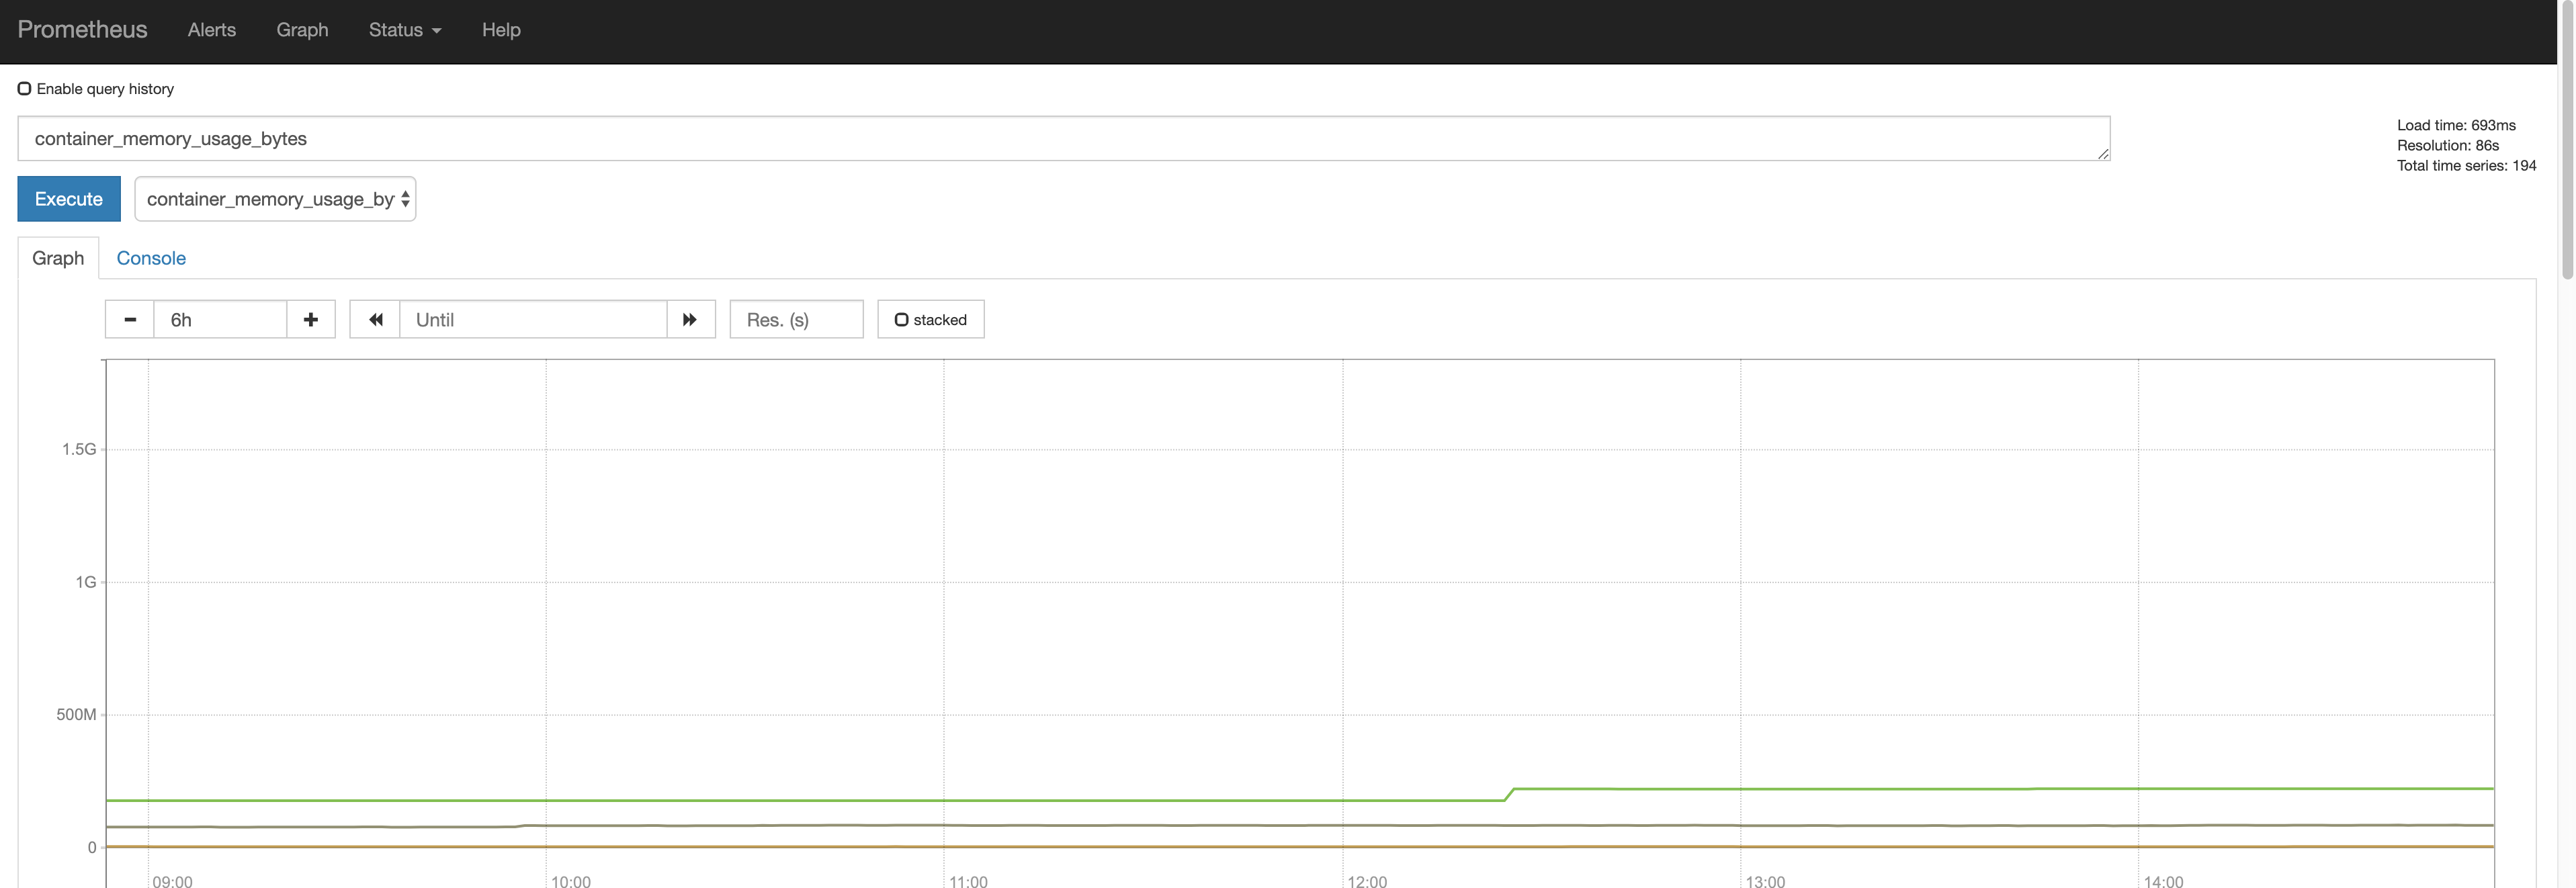
And access it by simply opening the url: http://127.0.0.1:9090.
Prometheus
Once you open it, you should see something like this, after running a small query:
Adding in Resources to monitor
In order to add a resource to monitor simply insert these annotations:
  annotations:
      prometheus.io/scrape: 'true'
      prometheus.io/port:   '9090'
Done.
Bonus Round – Graphana
We deployed Athens and Prometheus to monitor our cluster. We don’t have anything before Prometheus that would be fancy, but installing Graphana is actually pretty easy. You can follow the instructions here.
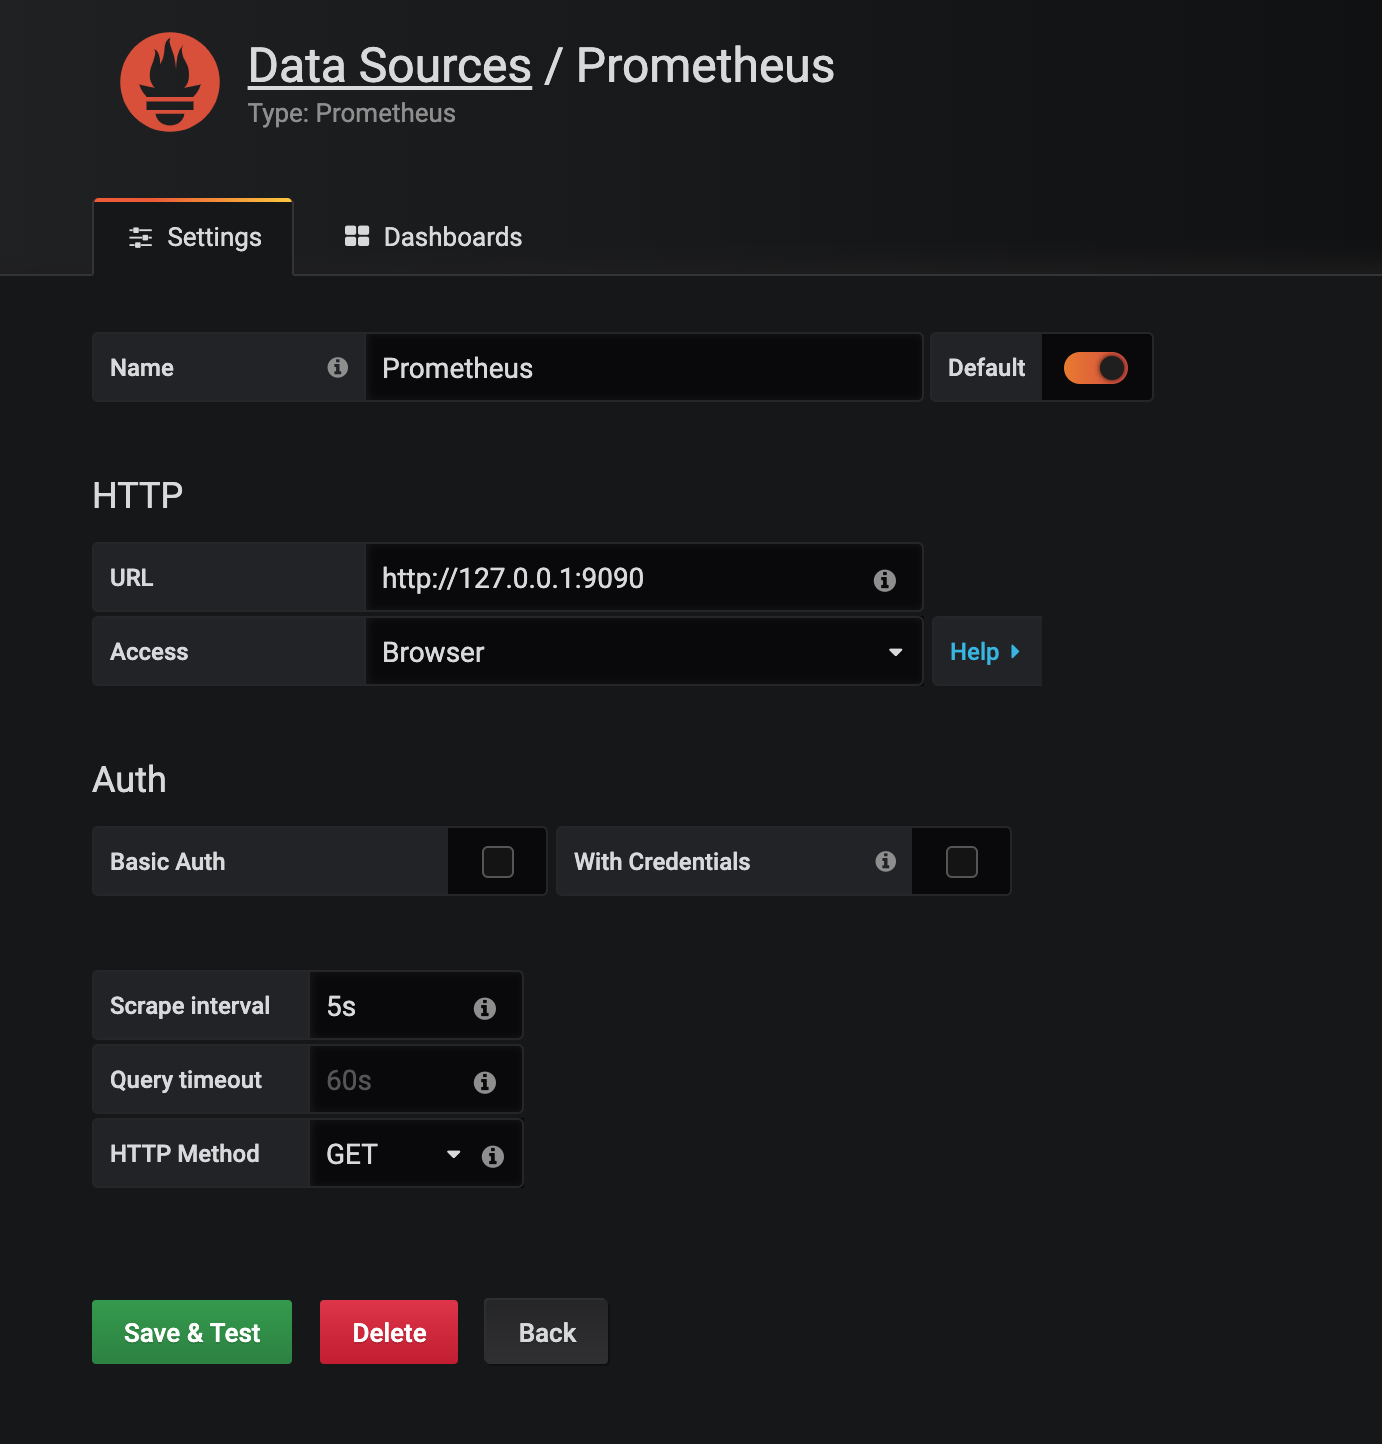
A very easy way of looking at some nice metrics without worrying about anything like users and such, is running a Graphana instance in docker on your local machine with:
docker run -d -p 3000:3000 grafana/grafana
… and while you are forwarding the Prometheus end-point you navigate to your Graphana instance by opening 127.0.0.1:3000 and install a Prometheus data-point like this:
After that navigate to a new dashboard and select a simple PromQL metric to see if it’s working. You should see something like this:
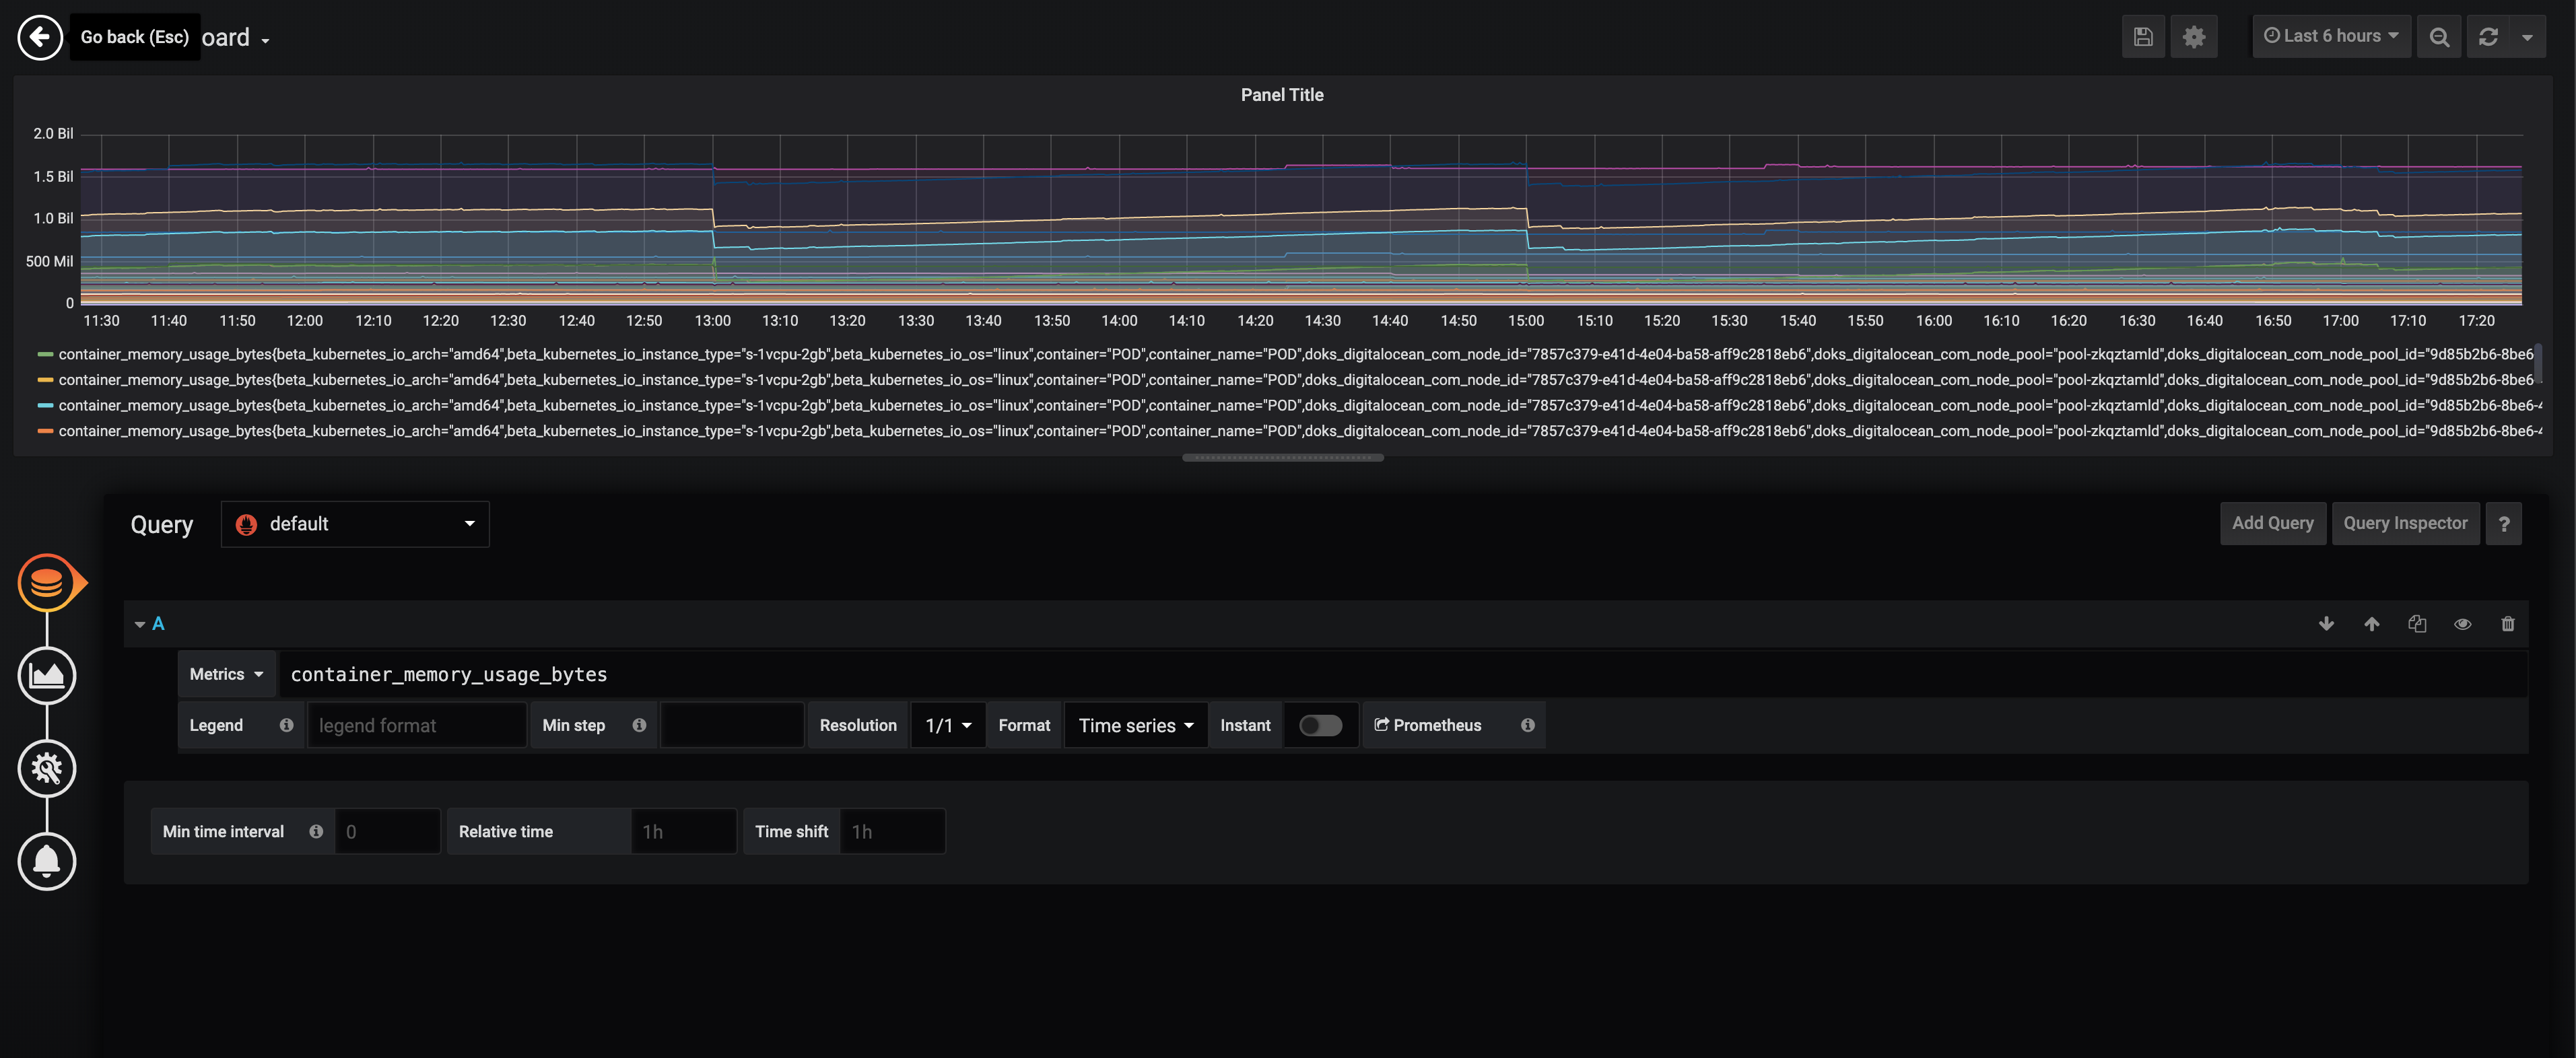
Now you can create a new dashboard add a PVC to our Prometheus instance and enjoy all the metrics you can store!
Conclusion
And this is it folks. Everything is installed and we can monitor things now. If you give Prometheus a PVC you can build some pretty awesome time series graphs too and see how your cluster behaves over time.
Thank you for reading! Gergely.